I think most people have a reasonable mental model of how road safety works. Roads get built. People drive on them. When something goes seriously wrong — an accident, an injury — a police report is filed, the data enters a database, and that database informs decisions about which roads need attention. It's not an unreasonable system. It's just that I believe it has a fundamental gap, and the gap is much larger than most people realize.
The gap is this: the database only contains events severe enough to generate a police report. Everything below that threshold — every hard brake, every swerve, every moment where a routine commute briefly became an emergency — simply disappears. The driver's heart rate returns to normal, they keep driving, and no record is created. The road continues to appear safe because no one is counting the times it almost wasn't.
We decided to try counting. We put cameras on thousands of vehicles across six continents. Each camera runs AI on the device itself — no cloud upload, no reviewing hours of footage. It watches the road continuously and flags the moments that matter: harsh braking, swerving, close calls. Each flagged event gets tagged with video, GPS coordinates, speed data, and motion sensors.
What I want to do in this post is walk through a few specific examples of what we found, because I think the concrete cases are more illuminating than any abstract argument I could make about the state of road safety data.
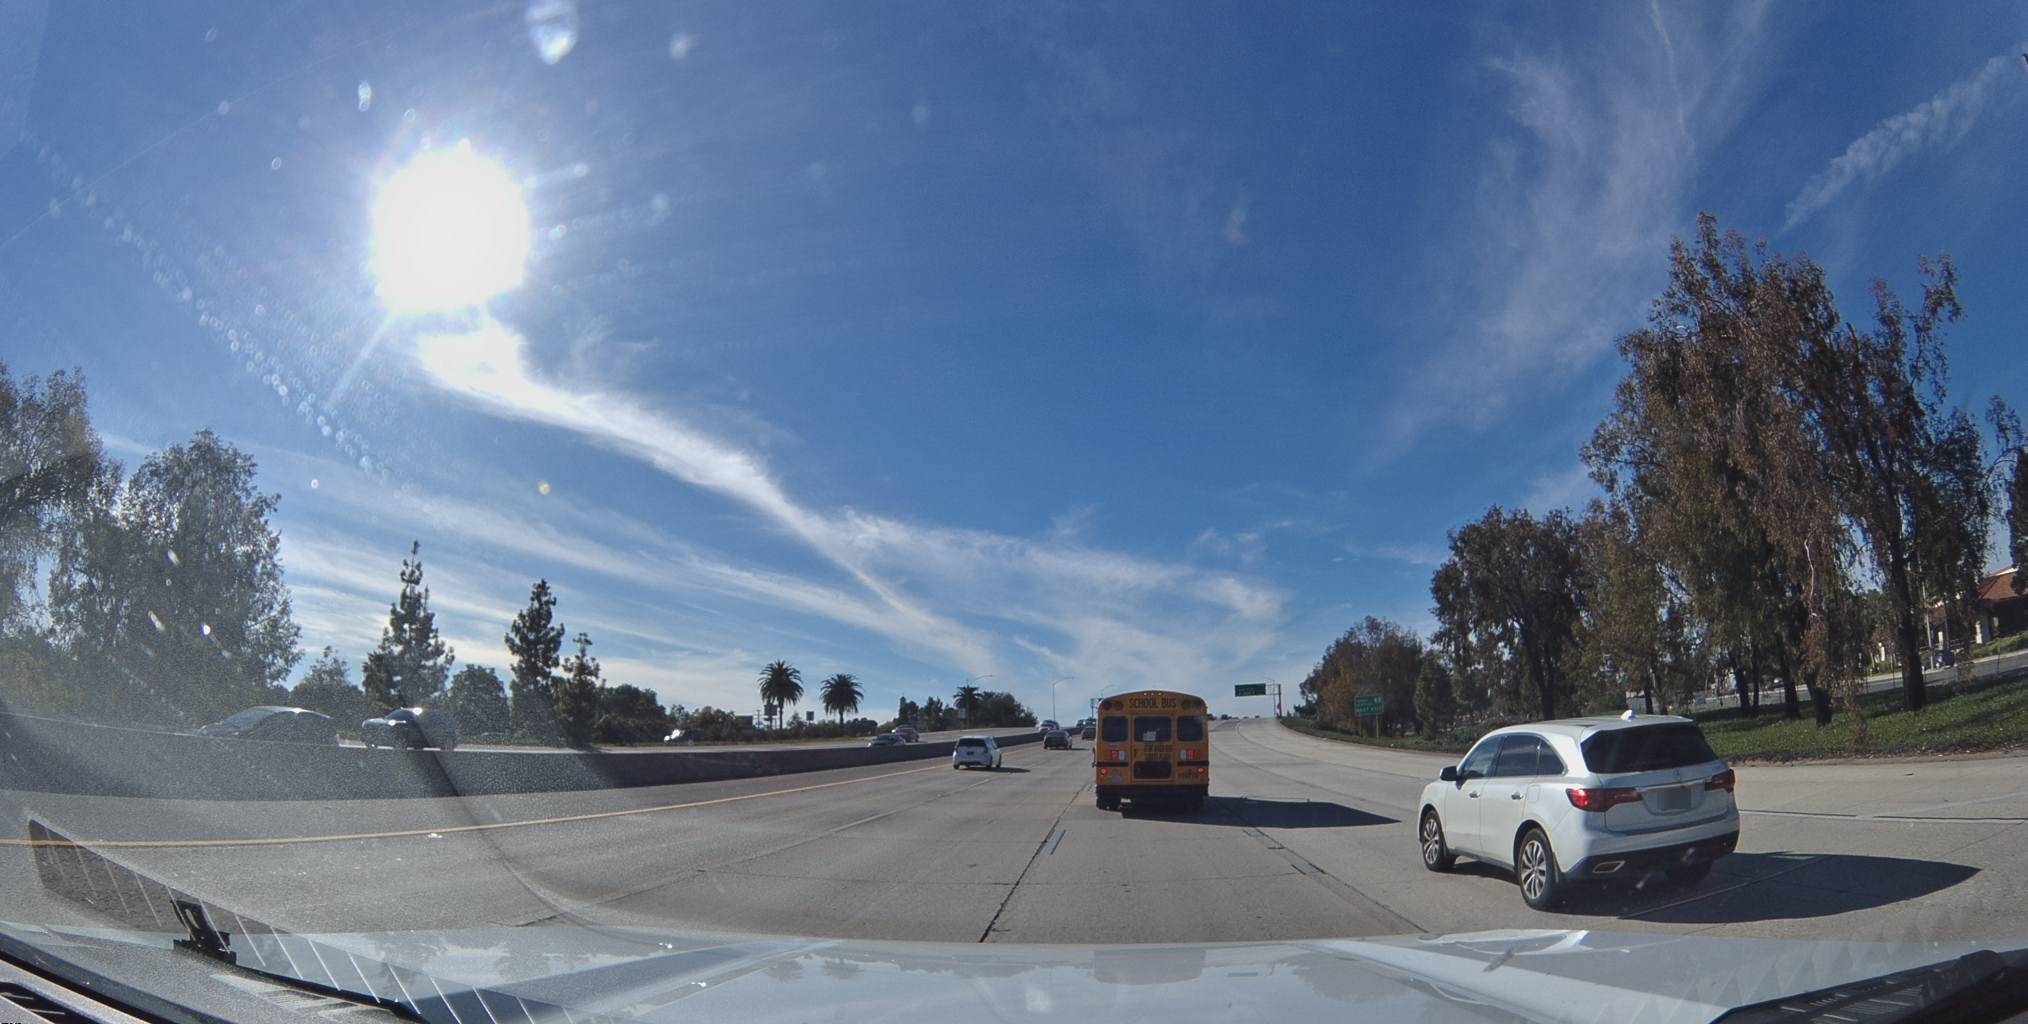
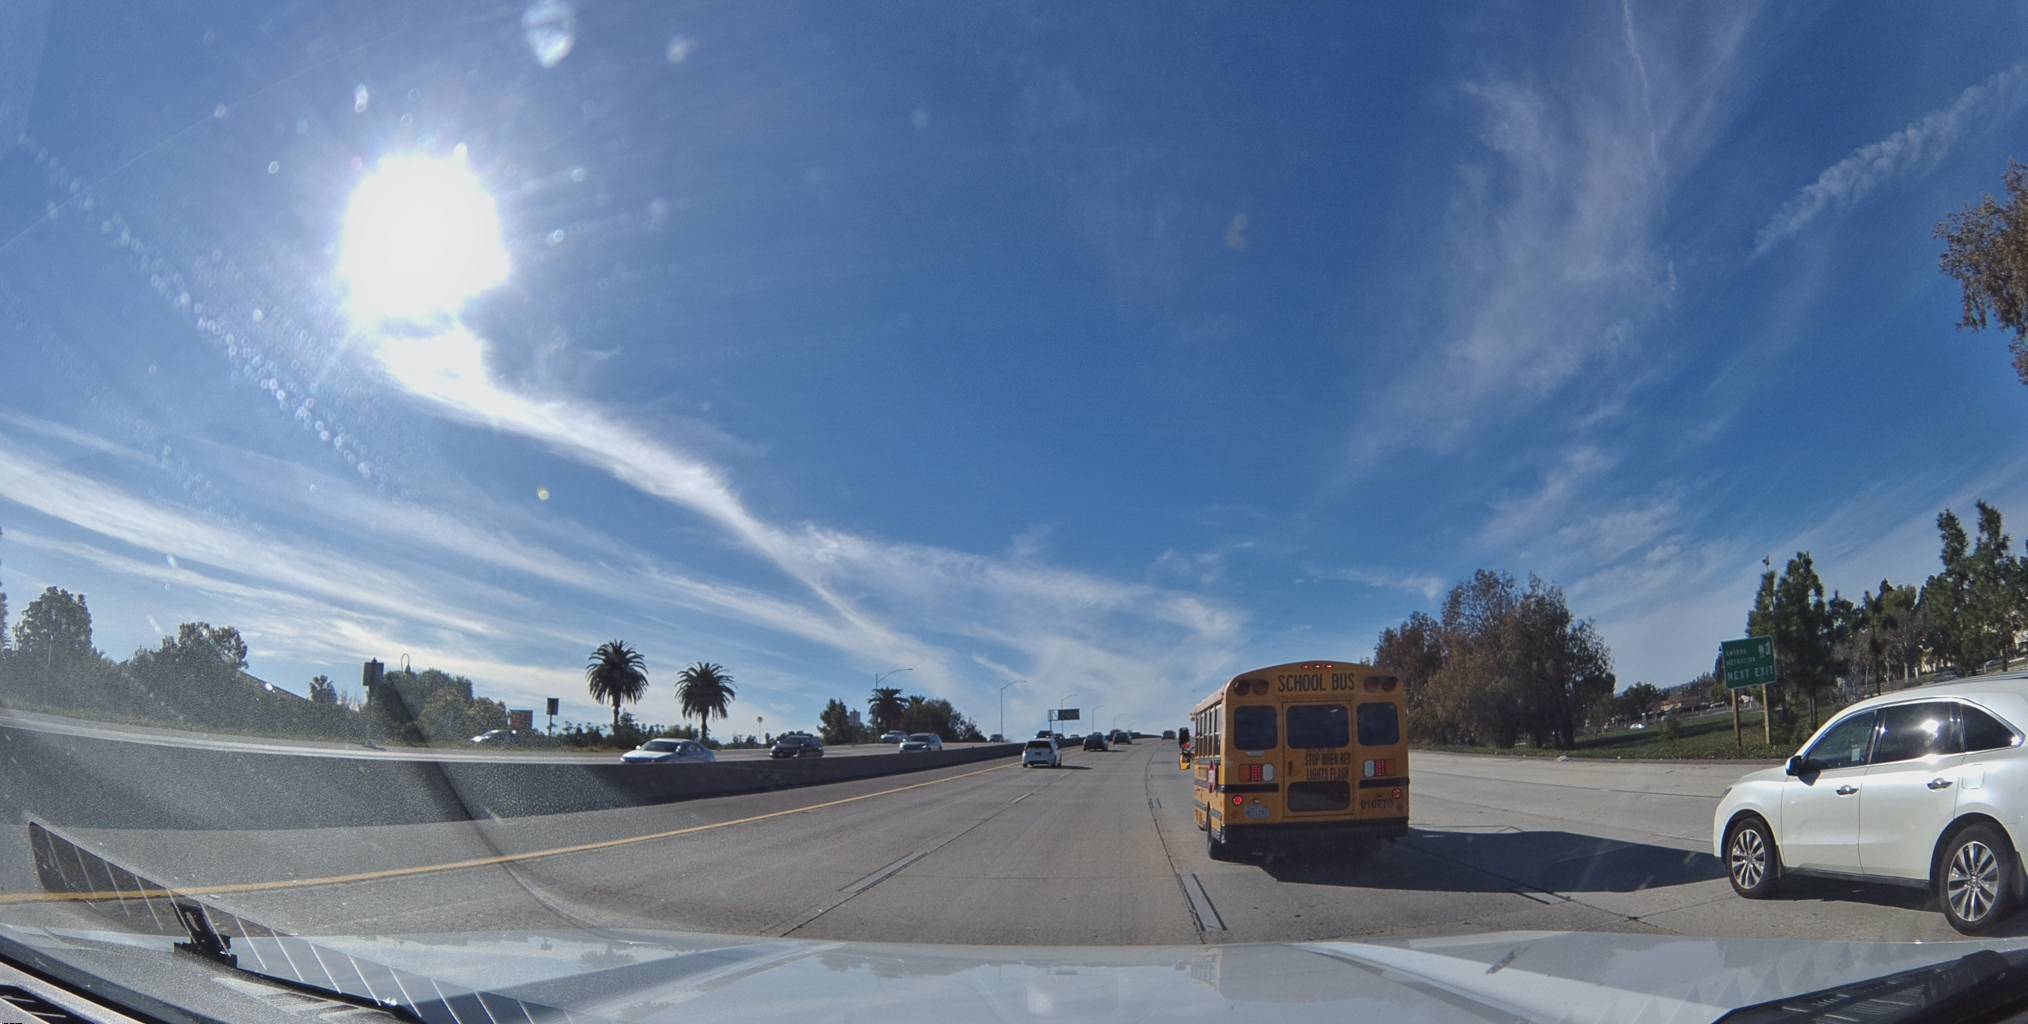
Highway 101, Camarillo, California
There's a stretch of Highway 101 outside Camarillo that you would not think twice about if you drove it on a weekday morning. Six lanes, sound walls, unremarkable in every way.
On January 2nd at 11:33 AM, one of our cameras recorded a vehicle on this stretch traveling at 70.7 mph — roughly matching the flow of traffic around it. Fourteen seconds later, the vehicle had decelerated to under 10 mph. A full emergency braking event — 70 to 50 to 30 to 10 — triggered by a traffic shockwave propagating backward through the lane.
No accident occurred. No police report was filed. No insurance claim. In the official system we've built to understand road safety, this event does not exist.
Our camera recorded it: video, GPS coordinates, a continuous speed curve, and IMU data capturing every force on the vehicle. This is one of thousands of similar events we've captured on this stretch alone.
I want to emphasize what I think is the key point here. This is not an edge case. This is normal. The speed trace — a flat line at 70 that suddenly drops off a cliff — is a pattern we see over and over, on roads that official data describes as safe.
The B4, Lower Saxony, Germany
On January 20th at 5:50 PM, a vehicle was heading south on the B4, a federal highway between Hamburg and Lüneburg. It was already dark — the sun sets early in northern Germany in January. The vehicle was traveling at 140 km/h, about 86 mph, which is a normal speed for this road outside the cities.
Then the vehicle dropped from 140 to 42 km/h. Nearly 100 km/h of speed shed in seconds. The kind of deceleration where everything unsecured in the vehicle becomes a projectile.
No police report was filed. No one called anyone. As far as the German road safety infrastructure is concerned, this did not happen.
Our record of this event consists of dashcam video, a GPS track, a continuous speed curve, and motion sensor data. I think the difference between what our system captured and what the official record shows is not a matter of degree — it's a difference in kind. One is a story someone might tell from memory, days later, if they tell it at all. The other is a multi-sensor recording made by a device that doesn't forget and doesn't decide the event wasn't important enough to mention.
Montgomery County, Texas — 12:18 AM
Montgomery County sits just north of Houston. Past the sprawl, the roads are two-lane, lined with pine trees, and at night there are no streetlights.
At 12:18 AM on a November morning, a vehicle on one of these roads was doing 65 mph. Then it executed a full emergency stop — 65 to 0 — on a straight, dark road with no warning.
Something was on the road. We don't know what. A deer, a stalled vehicle, debris. Whatever it was appeared in the headlights suddenly enough to demand the most aggressive braking the vehicle could perform.
I think this is the category of event that the current road safety infrastructure is structurally incapable of detecting. There is no traffic camera on this road. No intersection study covers this stretch. The county has no mechanism for learning that this location is dangerous until enough people crash there — not brake, crash — to create a cluster on a map that someone reviews at a public safety meeting a year later.
Our camera captured it. The county's system did not. That gap is, I believe, the core of the problem.
The part I find most interesting
I want to come back to something more practical, because I think the most surprising thing we found wasn't any individual event — it was what happens when you put cameras on an ordinary fleet.
There's a plumbing company in Sacramento with twelve vans. The owner installed Bee cameras on each vehicle — not because he was interested in road safety data or building maps, but because they cost $19/month per vehicle. That's roughly half what legacy fleet management vendors charge, with no multi-year contract and no weeks-long onboarding. His office manager mounted all twelve cameras in a single morning.
Here's what I think is genuinely interesting about this: those twelve vans, driving their normal plumbing routes, are also capturing street-level imagery of every road they travel. Every speed limit sign, stop sign, and fire hydrant is detected and geolocated by the on-device AI. Every harsh braking event becomes a data point. The plumber's fleet is — without anyone planning it — building a continuously updated picture of how Sacramento's roads actually function in practice.
This data feeds into a system used by autonomous vehicle companies that need fresh maps, city planners looking for hazard patterns, insurance companies modeling risk, and AI labs that need real-world driving footage. Every mile driven makes the overall map more complete and more current.
The plumber did not set out to contribute to a map of the physical world. He wanted to know where his vans were. The map was a side effect.
Scale that across thousands of fleets and you begin to see the picture. Here is a single neighborhood in Los Angeles — every speed limit sign, stop sign, and fire hydrant detected and positioned by AI, from ordinary vehicles driving ordinary routes:
AI-Detected Road Features in Venice, Los Angeles
Metadata
Try this API query
I think the situation is roughly this: roads have been generating safety-relevant information for as long as people have been driving on them. Where they're dangerous, when they're dangerous, how people actually use them versus how they were designed to be used. The system we built to capture that information — crash reports, police databases, public safety reviews — captures almost none of it. It captures the catastrophes. It misses the near-catastrophes. And the distance between those two categories is where I believe most of the actionable information actually lives.
There are now cameras on windshields in dozens of countries, each one running AI, each one turning an ordinary drive into structured data the world has never had before. Including, in Sacramento, the daily rounds of a plumbing company with twelve vans and a laminated poster in the break room that says DRIVE SAFE.
The poster had the right idea. But the roads have more to say.
Follow us on X | Try Bee Maps for Free | Buy a Bee