January 2, 2026 -- Camarillo, California
At 11:33 on a Thursday morning, a dashcam-equipped vehicle was heading southeast on Highway 101 near Ventura, cruising in the flow of traffic at roughly 70 miles per hour. The sky was overcast, the road was dry, and there was nothing about the moment that suggested anything was about to go wrong. That is, of course, the nature of near-misses. They never announce themselves.
Twenty-eight seconds later, the vehicle had decelerated from 70.7 mph to 3.2 mph. The driver was unharmed. No metal was bent. No glass was broken. No police report was filed.
But a Bee camera mounted on the windshield captured everything: the video, the speed, the GPS coordinates, the rotational forces on all three axes, the exact fraction of a second when the brakes engaged. An AI system classified the event, analyzed the scene, and made the data available through an API -- all without a single human being writing anything down.
This is the story of event 69581dad62cb7e369e720878. One harsh braking event among thousands. But when you look at it closely, it tells you something about what road safety data can actually be.
The Speed Curve
Start with the numbers.
The Bee camera records speed at sub-second intervals, producing a dense time series for even a short event. For this 28-second window, there are dozens of data points tracing a curve that reads like a short story with a very sudden climax.
For the first fourteen seconds or so, the speed holds remarkably steady. The vehicle is doing between 68 and 71 mph -- typical highway cruising speed, the kind of pace where your hands relax on the wheel and the engine settles into a drone. The speed profile is nearly flat. The road is straight. Traffic, presumably, is flowing.

Then, somewhere around the 15-second mark, the line breaks.

It does not taper. It does not gently descend. It drops -- steeply, almost vertically on the chart. From 70 mph to 50. From 50 to 30. From 30 to 10. The recorded peak deceleration reaches 1.442 m/s squared, which may sound modest in the abstract but translates to the kind of braking where loose items on the passenger seat end up in the footwell and your seatbelt locks hard against your chest.

By the 25-second mark, the vehicle is barely moving. The minimum recorded speed is 5.1 km/h -- about 3.2 mph -- essentially a crawl. Whatever happened, it required the driver to go from highway speed to a near-stop in roughly ten seconds.
The speed profile alone does not tell you why. It tells you something happened. It tells you it was abrupt. But for the why, you need the video.
What the Camera Saw
The Bee dashcam records continuous video from the windshield, and when the AI event detection system flags a harsh braking event, the relevant clip is preserved and made available alongside the telemetry.
Here is what the scene analysis found:
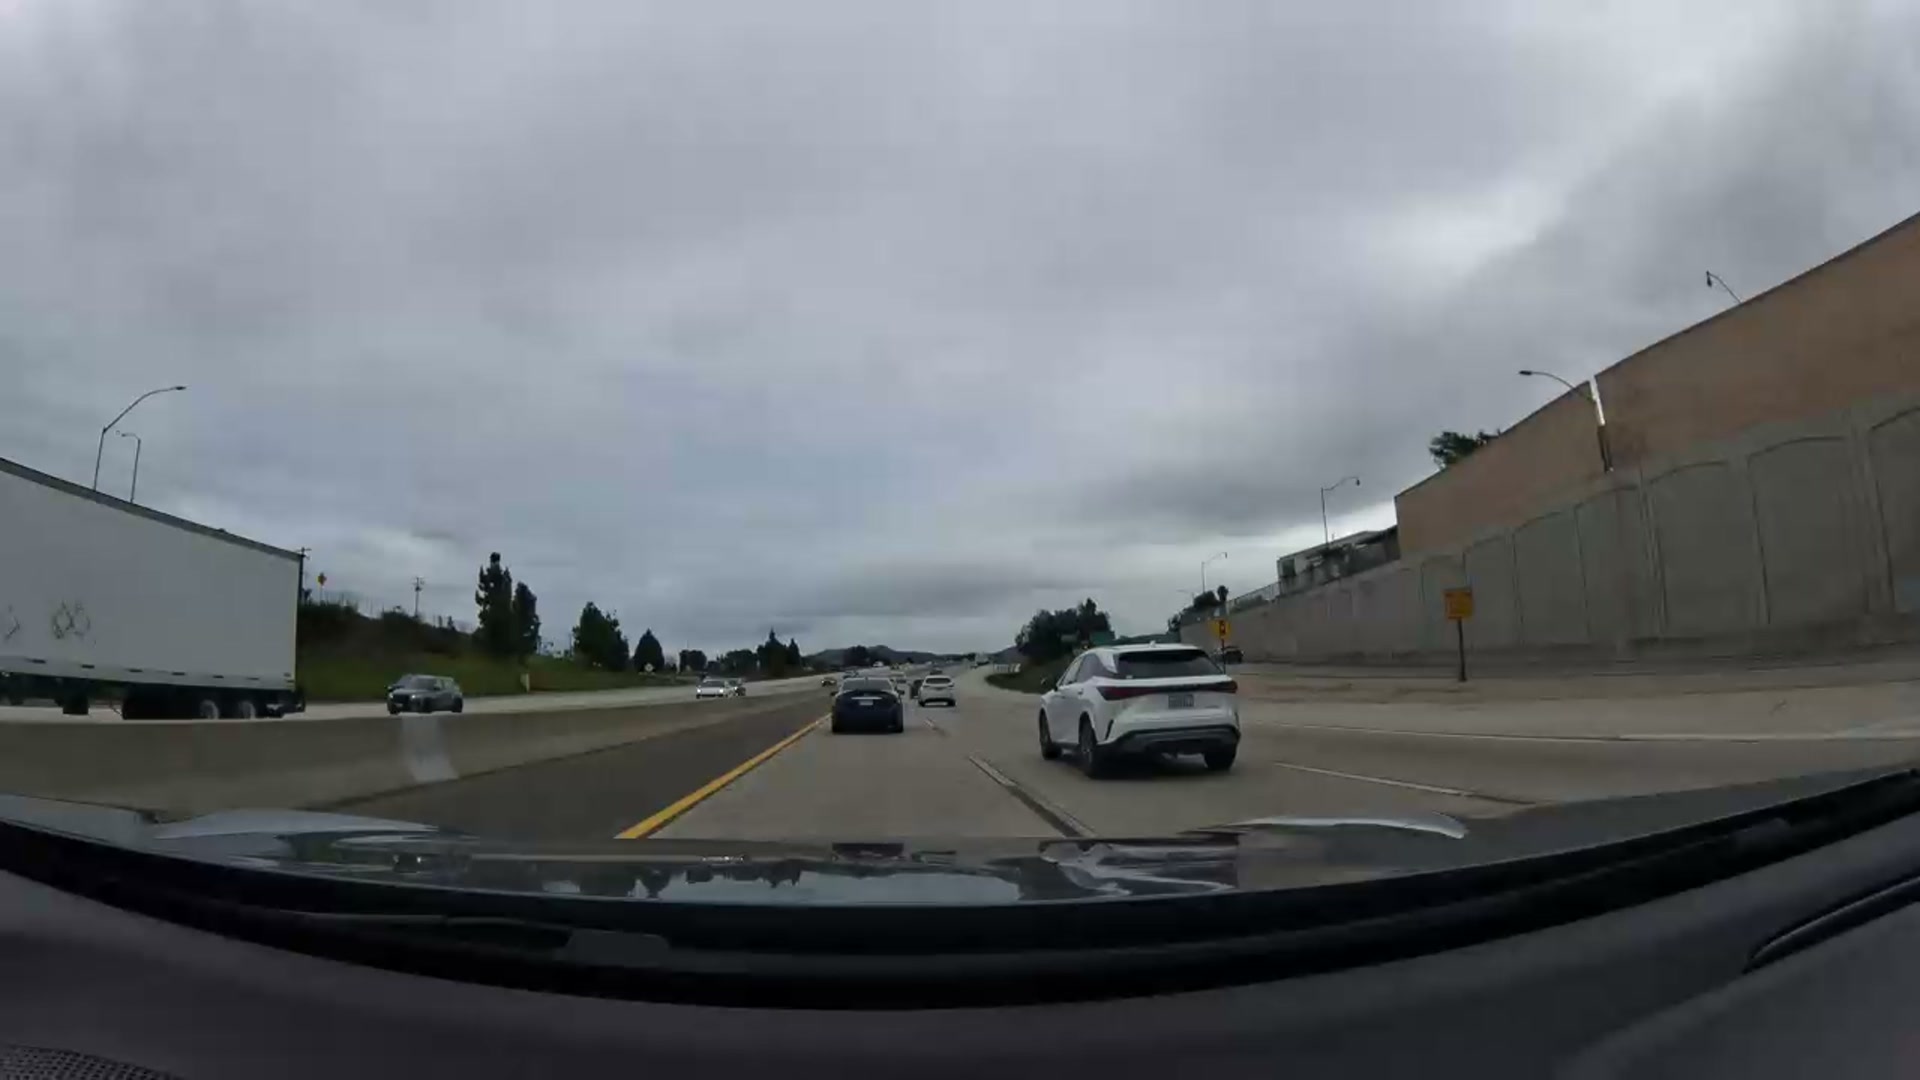
The vehicle is traveling on a divided highway with multiple lanes -- six lanes total, separated by a median, with retaining walls on both sides and a shoulder. Traffic is moving. The camera vehicle is in its lane, maintaining speed.
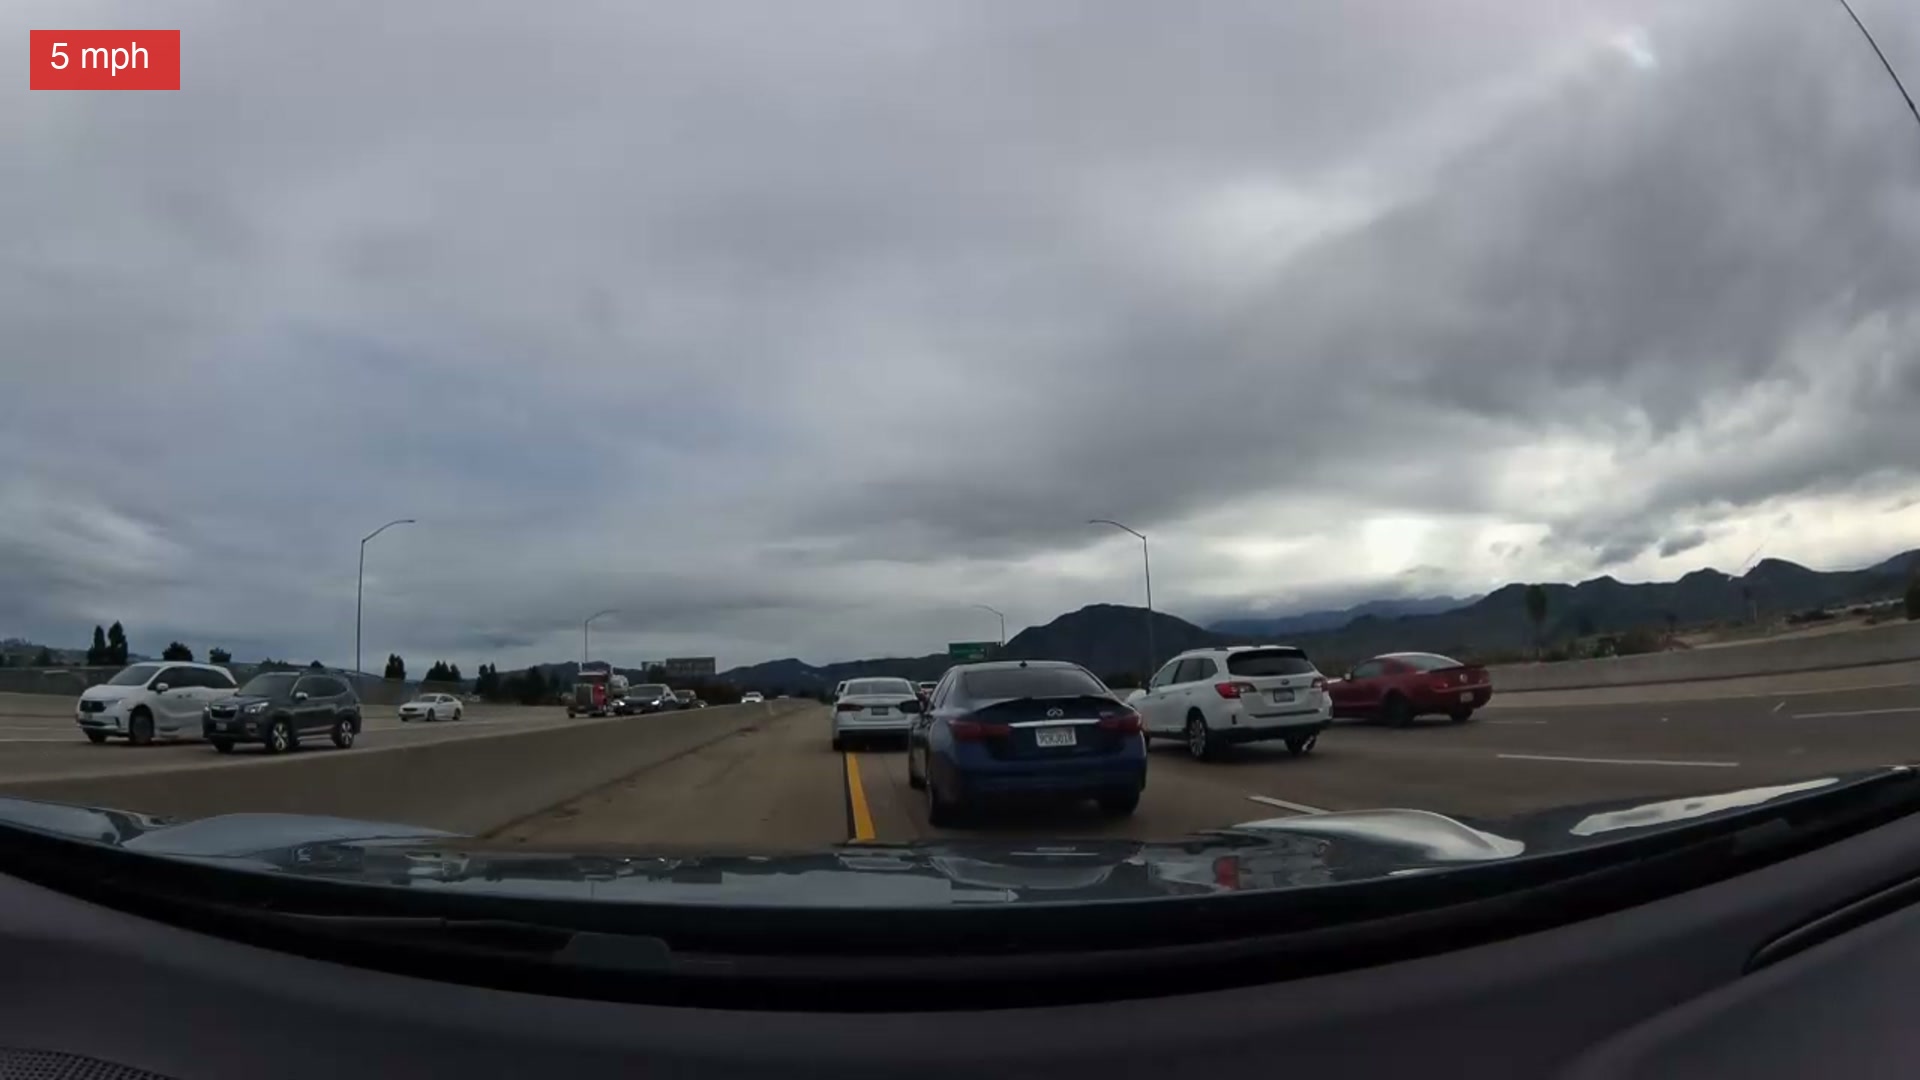
Then the brake lights ahead ignite. Not one car -- all of them, in rapid succession. A wave of hard braking rolls backward through the traffic stream, the kind of sudden compression that turns a flowing highway into a parking lot in seconds. The vehicles ahead are slamming on their brakes, and by the time the camera vehicle registers what is happening, the gap is closing fast.

The dashcam footage makes the dynamic viscerally clear. One frame shows open road and flowing traffic. A few frames later, every vehicle in sight has its brake lights on and the camera vehicle is bearing down on the dark sedan ahead at a closing speed that leaves no margin for hesitation.

This is what highway engineers call a shockwave: a pulse of deceleration that propagates backward through traffic, often faster than the vehicles are moving forward. A driver a quarter mile ahead taps their brakes. The driver behind brakes slightly harder. The effect amplifies with each successive vehicle until, several cars back, someone is executing a full emergency stop from 70 mph. The camera vehicle was deep enough in the chain that the stop was violent.

None of this is speculation in the traditional sense. It is an AI reading video frames, identifying vehicles, tracking their behavior relative to the camera vehicle, and producing a structured assessment. The system rated this a near-miss. Looking at the speed curve and the footage, it is hard to argue.

The Sensor Data
The video and speed profile are the most immediately legible parts of this event. But the Bee camera is recording far more than that.
GNSS track. The camera logs GPS coordinates throughout the event. For these 28 seconds, you get a precise path plotted on the map: the vehicle's exact position on Highway 101 at each moment, accurate enough to identify which lane it occupied. The coordinates -- centered around 34.216829 latitude, -119.034344 longitude -- place the event on the southbound stretch of the 101 just northwest of Camarillo, a section where the highway runs through a corridor flanked by commercial development and sound walls.
Six-axis IMU. The inertial measurement unit captures three axes of acceleration and three axes of rotation. The accelerometer data shows the longitudinal force of braking -- the forward pitch of the vehicle as kinetic energy converts to heat in the brake pads. The gyroscope data captures any yaw or roll: did the vehicle swerve? Did it track straight? The IMU answers these questions with data, not recollection.
Speed array. Not just a start speed and an end speed, but a full time series. Each data point carries a timestamp, allowing you to reconstruct the deceleration curve at high resolution. You can calculate the instantaneous deceleration rate at any point during the event. You can identify the exact moment the brakes were first applied and the exact moment the vehicle came to its near-stop.
Road classification. The system knows this is a 6-lane divided highway. It knows there is a median, a shoulder, and retaining walls. The posted speed limit is 40 mph -- which means the vehicle, along with the rest of traffic, was traveling at nearly twice the legal limit. That fact alone adds context to the severity assessment.
Lighting and conditions. Overcast sky. Daylight. Dry road. These are not inferred from weather forecasts or estimated from the time of day. They are read from the video itself.
This single 28-second event contains hundreds of individual data points across multiple sensor streams. It is, by any reasonable standard, one of the most thoroughly documented near-misses you will ever encounter.
What Makes This Different
Consider, for a moment, how this event would appear in traditional road safety data.
If the driver had not braked in time -- if this had been a collision rather than a near-miss -- there might eventually be a police report. That report would note the date, the approximate location, and a brief narrative: "Vehicle 1 braked hard on Highway 101. Vehicle 2 changed lanes. No injuries." It would be filed days or weeks later, based on the recollections of shaken participants. It might or might not include a diagram. It would almost certainly not include video.
And if the driver did brake in time -- which is what happened here -- there would be no report at all. Near-misses are, by definition, non-events in the traditional safety data pipeline. They do not generate police reports. They do not appear in crash databases. They are moments that happen, that the driver's heart rate remembers for a few minutes, and then they vanish. They are the dark matter of road safety: omnipresent, consequential in aggregate, and almost entirely unobserved.
This event is different. For event 69581dad62cb7e369e720878, the record includes:
- Full dashcam video of the incident
- A precise speed curve at sub-second resolution
- An exact GPS track showing the vehicle's path on the highway
- Six-axis inertial measurements capturing the forces involved
- An AI scene analysis identifying the cause, the actors, and the severity
- Road classification data: lane count, road type, divider configuration
- Ambient conditions: lighting, weather, visibility
- A severity rating and near-miss classification
All of this was captured automatically. No human being pulled over to write anything down. No form was filled out. No phone call was made. The camera recorded, the AI classified, and the data became available through a structured API. The entire pipeline from event to indexed, queryable record required zero manual intervention.
The Bigger Picture
This event was detected, classified, and made available through the Bee Maps API within hours of occurring. One camera. One moment on one highway on one overcast Thursday morning.
Now consider the scale. Bee Maps' network consists of dashcams mounted on vehicles around the world, each one recording continuously, each one running the same event detection pipeline. Every harsh braking event. Every hard acceleration. Every sharp swerve. Detected, timestamped, geolocated, and enriched with video and sensor data.
Multiply event 69581dad62cb7e369e720878 by the number of cameras on the network. Multiply it by the number of miles driven each day. What emerges is not a collection of anecdotes. It is a continuous, high-resolution measurement of how roads are actually used -- and where they are dangerous.
Traditional road safety analysis works backward from collisions. It waits for things to go wrong, then counts them up, then draws conclusions. It is reactive by nature and slow by necessity. The data is sparse because only the worst outcomes are recorded.
A network of AI-equipped dashcams inverts this. It captures the near-misses -- the events that reveal danger before a crash confirms it. It captures them with a density and fidelity that no human reporting system can match. And it captures them continuously, building a picture of road risk that updates not quarterly or annually but daily.
Accessing the Data
Everything described in this post -- the video, the speed profile, the GNSS track, the IMU data, the AI classification -- is available programmatically through the Bee Maps AI Events API.
The API exposes two primary endpoints. The search endpoint (POST /aievents/search) lets you query events by date range, event type, and geographic area. You can filter for specific categories -- HARSH_BRAKING, AGGRESSIVE_ACCELERATION, SWERVING, HIGH_SPEED, HIGH_G_FORCE, STOP_SIGN_VIOLATION, TRAFFIC_LIGHT_VIOLATION, TAILGATING -- or retrieve everything within a time window. Geographic filtering supports both bounding boxes and arbitrary polygons, so you can scope queries to a single interchange, a highway corridor, or an entire metro area.
A basic search looks like this:
curl -X POST https://beemaps.com/api/developer/aievents/search \
  -H "Authorization: Basic <your-api-key>" \
  -H "Content-Type: application/json" \
  -d '{
    "startDate": "2026-01-01T00:00:00.000Z",
    "endDate": "2026-02-01T00:00:00.000Z",
    "types": ["HARSH_BRAKING"],
    "limit": 50
  }'
Each event in the response includes a unique ID, timestamp, GPS coordinates, event type, and a video URL. To get the full sensor payload for a specific event, hit the detail endpoint (GET /aievents/{id}) with optional query parameters for GNSS and IMU data:
curl https://beemaps.com/api/developer/aievents/69581dad62cb7e369e720878\
?includeGnssData=true\&includeImuData=true \
  -H "Authorization: Basic <your-api-key>"
That single call returns everything we analyzed in this post: the video URL for frame extraction, the full GNSS track with sub-second positioning, six-axis IMU recordings, and the speed profile. Authentication uses a Base64-encoded API key passed as a Basic auth header.
The data is real, it is available now, and it covers roads across dozens of countries. Whether you are a traffic engineer investigating a dangerous corridor, a researcher studying braking shockwaves, or a developer building the next generation of road safety tools -- the API gives you direct access to the same rich, multi-sensor event data that made this 28-second reconstruction possible.
Twenty-eight seconds on Highway 101. A braking shockwave rolling through traffic. A hard stop that ended without consequence. In the old model, this event simply never existed. In the new one, it is a data point -- one of millions -- in an emerging map of how the world's roads actually behave.
That is what continuous road safety monitoring looks like. Not a revolution announced with fanfare, but a quiet accumulation of moments like this one, each captured in granular detail, each contributing to a picture that was previously invisible.
The driver on Highway 101 continued on their way. The data remained.
Follow us on X or Try Bee Maps for Free.