The Latest Buzz
Enhancing Performance: Our Website Redesign Journey

At the heart of our recent website redesign is our unwavering commitment to enhancing performance for our users. We have meticulously streamlined the codebase, resulting in significantly faster load times. This means you can access the information you need more quickly and efficiently than ever before. In addition, we have introduced new metrics for the Network, offering users better insights and more detailed information, all while ensuring our pages are friendlier for mobile device users.
A Unified Design Language
A key aspect of this project was the creation of a unified design language, ensuring a consistent and cohesive experience across all pages. This redesign sets the stage for future enhancements, such as improvements to Scout and more informative maps that include roadwork updates. Our goal is to provide a seamless and intuitive user experience that makes navigating our site easier and more enjoyable.
Ongoing Developments
Our work doesn’t stop here. Developments are ongoing, and we have laid the groundwork for additional improvements in the coming weeks and months. Stay tuned for updates as we continue to enhance the functionality and usability of our website.
—
Here is a snapshot of our latest updates:
Network > Coverage
The Coverage Map now displays a range of metrics, including Unique KM Mapped, Total KM Mapped, and Global Coverage %. Freshness hexes have been introduced to give users a clear view of the most recent updates. The map also includes search functionality, dark and light modes, and a pulsing live location dot for real-time navigation. Notably, regions are no longer displayed as a map layer or listed in the search function. Instead, region lists and metrics can now be found under Network > Regions, with region maps displayed under Regions > Location > Map.
Network > AI Trainers Reviews
This section displays a list of recent Map AI submissions, categorized by Map AI Trainer, Location (USA / EU / Global), Review Type, and Submission Date/Time. Users can view a three-month chart and find calls to action (CTAs) to purchase a dashcam or train Map AI.
Network > Contributors
Here, users can browse a paginated list of all Hivemapper contributors, sorted by the most recent join date. The list includes the contributor’s name, join date, and last seen date. Similar to the AI Trainers Reviews, this section also includes a three-month chart and CTAs to purchase a dashcam or train Map AI.
Network > Regions
This section displays a paginated list of all Hivemapper regions, with metrics such as Region Name, KM Mapped, and Multiplier. Users can search for specific regions, and clicking on a region expands the Region Metrics, allowing users to view the Region Map. Metrics include Progress, Total KM, Unique KM, Contributor Count, Multiplier, Weight, Activity Progress, Coverage Progress, and Resilience Progress. Additionally, users can view percentage metrics of all-time coverage from the United States, Canada, Europe, and East Asia.
Console > Developers
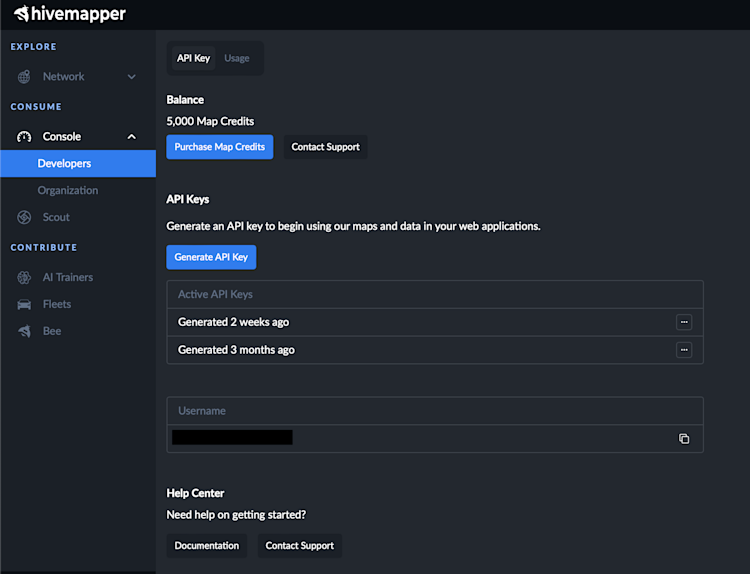
This section, accessible with login, provides supporting documentation and features for developers. Users can view or purchase Map Credits, generate or deactivate API Keys, and copy their username. It also includes resources to view documentation, contact support, and download usage CSVs. The data displayed includes area, credits, payload, timestamp, and weeks.
Console > Organization
Similar to the Developers section, this part of the console requires login access and offers supporting documentation. Users can view or edit the organization name, view or purchase Map Credits, and access resources for documentation and support. Additional functionalities include creating an organization, adding or removing users, and assigning roles (Editor/Viewer) to users by username.
Console > Scout
The Scout section also requires login access and includes supporting documentation. Users can upload CSV or GeoJSON files to monitor locations using Hivemapper imagery, with support for location addresses, descriptions, and tags. Users can add or remove locations and view monitored locations in a paginated list. Scrolling left and right reveals available image sequences from different times or dates, and clicking on an image sequence expands the location with all accessible imagery.
Location Details and Map View
The Locations screen displays a user/organization’s monitored locations sorted by most recently seen. In Location Details, users can view a single monitored location in a focused view. A map displays drive paths where images were taken, and users can scroll through photos using arrows or select the individual dots on the drive paths. The date and time of the images are displayed, and images can be expanded to full screen. In Map View, all monitored locations are displayed on a map, with clickable locations that expand to show location details.
— -
Our redesigned website marks a significant step forward in delivering a more efficient, informative, and user-friendly experience. We are excited about these improvements and look forward to bringing you even more updates in the near future!
Share Post


